Alright, so you’ve got your rasterized image, and now you want to save it to a file. You want a single file to contain all the data necessary for viewing this image, so that all a person needs is the single image file and an image viewer to look at your image. How do you save the data?
Grayscale
Grayscale images are a bit simpler than color images so we’ll start there.
Number of bytes to store the image
For the moment, let’s consider only the number of bytes that would be required for the pixels in a grayscale image, without thinking about the storage layout or the metadata. Recall that typically for a grayscale image, there’s one value for each pixel. Commonly, an 8 bit value (= 1 byte) is used for a value, allowing the pixel intensity value to range between 0 and 255. A rectangular image that’s W pixels wide and H pixels in height would have WxH total pixels. For example, if your image is 100 px wide & 200 px tall, there would be 100 x 200 = 20,000 pixels total. If each pixel can be represented by 1 byte, storing this image uncompressed would require 20,000 bytes.
Metadata
So you have your 20,000 bytes representing an image that’s 100px wide x 200px high image. Or was that 200px wide x 100px tall? Or 50px wide and 400px tall? How would an image viewer know how to display the 20,000 image bytes using only the image file?
The image file must contain data about the image, which is called metadata. The metadata typically contains information such as width, height, the component colors (aka channels or separations), and much more. This metadata is stored in the image file in a section that’s separate from the image data. Different containers such as JPG, GIF, TIFF, or PNG each have different ways of storing the metadata, and each container can store different metadata. When an image viewer detects a container, it must know where and how the metadata is stored in that container, and how to read the required metadata.
Image metadata is topic worthy of a series of articles. For an idea of the scope of the topic, the TIFF tags reference (metadata in TIFF can be stored as tags) describes hundreds of well-defined tags which describe everything from the basics like width and height all the way to niche information like the host computer used during image creation. And that is only for a single image container, TIFF!
For this article, it’s enough to know that there’s metadata in the image file that describes the image data.
Which byte represents a particular pixel?
So we’ve got our 20,000 bytes of data, and we know how wide and tall the image is. But which of the 20,000 bytes represents the top left pixel? In general, which byte represents the pixel at position (x, y)?
The answer to that question lies in the storage order of the pixels. Let’s assume that the pixels are stored in row-major order – in other words, all the pixels of a row N are stored before all the elements of row N + 1. Below is an example 2×2 image containing 4 pixels. They are labeled pixel(0,0) through pixel(1,1).
| pixel(0,0) | pixel(0,1) |
| pixel(1,0) | pixel(1,1) |
A file saved in row-major storage would contain the pixels in the order below. Note that all the elements of the 1st row appear before all the elements of the 2nd row:
| pixel(0,0) | pixel(0,1) | pixel(1,0) | pixel(1,1) |
Pixels may also be stored in column-major order, but this is very unusual in the commonly used image layouts and I won’t describe that in this article.
So if we get the image’s height and width from metadata, and we assume that it’s in row-major order with the first data value holding the top left pixel, we can re-assemble this simple image using only the image file.
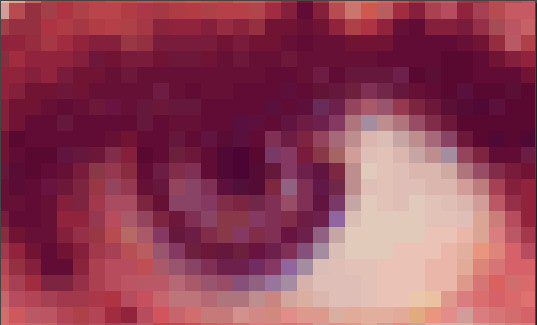
Color RGB images
Color images differ from grayscale images by containing effectively one image per color. Common color schemes are RGB (ideal for screens) or CMYK (ideal for print). We’ll now consider how to store RGB images.
Number of bytes to store an RGB image
Let’s consider only the number of bytes that would be required for the pixels in an RGB image, without thinking about the storage layout or the metadata.
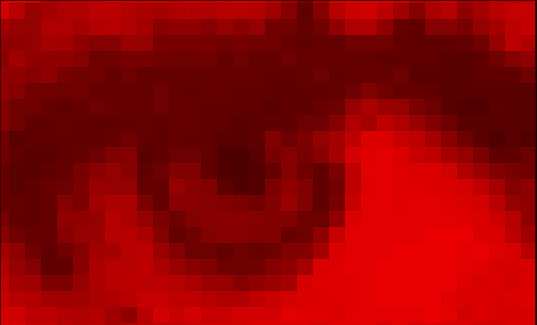
A color pixel can be represented using a value for each of the component colors. In an RGB pixel, there is one value for each of the red, green, and blue colors. Commonly, 8 bit (=1 byte) values are used for each of the 3 colors. Thus, 3 bytes are used for each RGB color pixel.
A rectangular image that’s W pixels wide and H pixels in height would have WxH total pixels. For example, if your image is 100 px wide & 200 px tall, there would be 100 x 200 = 20,000 pixels total. Thus, for any given image dimensions, the number of pixels is the same regardless of whether the color scheme is grayscale, RGB, or some other color scheme like CMYK. However, while each pixel in a grayscale image commonly requires 1 byte, each pixel in an RGB image commonly requires 3 bytes. Therefore, storing this image uncompressed would require 3 * 100 * 200 = 60,000 bytes.
Which bytes represent a particular pixel?
In contrast to grayscale images where 1 byte represents each pixel value, an RGB pixel commonly requires 3 bytes. Given this requirements, which bytes in an image file’s image data represent a given pixel?
Chances are that you’ve already thought of at least one of the two common methods:
- Interleaved: Store all the bytes for pixel N before storing the bytes for pixel N + 1
- Planar: Store all the bytes for color C before storing the bytes for color C + 1
Interleaved
In the interleaved storage layout, the bytes for a pixel are contiguous. In the 2×2 image below, each pixel has RGB components.
| pixel(0,0) | pixel(0,1) |
| pixel(1,0) | pixel(1,1) |
This data would be stored in interleaved, row-major layout like in the diagram below. The top row indicates the 0-based index of each byte. For compactness, the RGB components of pixel(x, y) are shown as xy.R, xy.G, or xy.B, respectively.
| 0 | 1 | 2 | 3 | 4 | 5 | 6 | 7 | 8 | 9 | 10 | 11 |
| 00.R | 00.G | 00.B | 01.R | 01.G | 01.B | 10.R | 10.G | 10.B | 11.R | 11.G | 11.B |
As you can see, the RGB components for pixel(0, 0) are contiguous. Furthermore, each pixel is still stored in row-major order. This is called interleaved because the data for the colors are mixed in a repeating pattern.
A notable property for this layout is that the bytes for the colors in the pixel at (x, y) can be found using simple formulas. Given that
* y = 0-based row index
* x = 0-based column index
* w = image width
We can find the red, green, and blue byte positions using the formulas below.
red   byte position for pixel(x, y) = y * w * 3 + x * 3 + 0
green byte position for pixel(x, y) = y * w * 3 + x * 3 + 1
blue  byte position for pixel(x, y) = y * w * 3 + x * 3 + 2
Planar
In the planar storage layout, the bytes for a color, rather than a pixel, are contiguous. For an example we can look at our usual 2×2 image, repeated below.
| pixel(0,0) | pixel(0,1) |
| pixel(1,0) | pixel(1,1) |
This data would be stored in planar, row-major layout like in the diagram below. The top row indicates the 0-based index of each byte. For compactness, the RGB components of pixel(x, y) are shown as xy.R, xy.G, or xy.B, respectively.
| 0 | 1 | 2 | 3 | 4 | 5 | 6 | 7 | 8 | 9 | 10 | 11 |
| 00.R | 01.R | 10.R | 11.R | 00.G | 01.G | 10.G | 11.G | 00.B | 01.B | 10.B | 11.B |
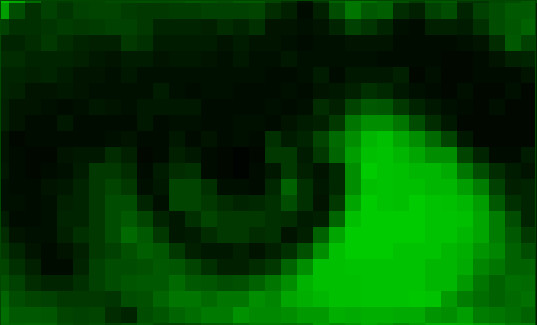
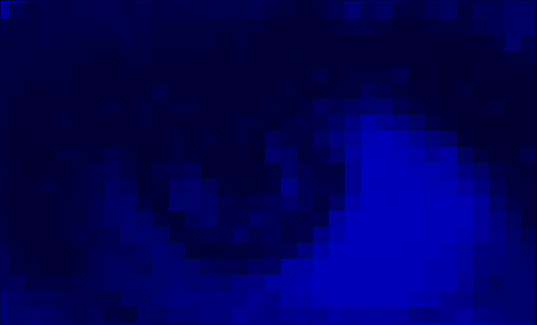
As you can see, all the red bytes are stored contiguously in the first 4 elements of the array, all the green bytes are stored contiguously in the next 4 elements, and all the blue bytes are stored contiguously in the last 4 elements. Finally, within each color, the bytes are stored in row-major order.
This layout is called planar because each color’s data is stored contiguously, like a planes of color data that can stacked to create the final image.
The image below shows the same data as above, with the addition of the top row, which indicates the 0-based index of each byte.
Like the interleaved layout, a notable property for this layout is that the bytes for the colors in the pixel at (x, y) can be found using simple formulas. Given that
* y = 0-based row index
* x = 0-based column index
* w = image width
We can find the red, green, and blue byte positions using the formulas below.
red   byte position for pixel(x, y) = 0 * w * h + y * w + x
green byte position for pixel(x, y) = 1 * w * h + y * w + x
blue  byte position for pixel(x, y) = 2 * w * h + y * w + x
When to use it: interleaved vs planar
Modern computers are generally designed to optimize for the common behavior that programs tend to access memory with addresses that are close together. This is known as the principle of locality.
This is relevant when deciding what memory layout to use for images. The different layouts store the same data. In interleaved, the bytes for a pixel are located close to each other in memory, while in planar, the bytes for a color are located close to each other. Therefore, it’s easy to conclude that if the program needs to do a lot of processing for each pixel, interleaved is probably going to be faster. If a program needs to do a lot of processing per color channel, planar is probably going to be faster.
Performance in an application’s important algorithms is typically the main reason to choose planar vs. interleaved layout.
Some examples of pixel-level processing tasks include on-screen display or color conversions.
Some examples of color channel-level processing tasks include blurring, sharpening, and simple edge detection.
There are also operations that are more or less layout-independent. These types of operations process per sample (an element of a pixel) rather than per-pixel or per-channel region. Some examples of this kind of processing include noise addition, quantization, and clamping (clipping).
Sometimes dramatic runtime improvements can be obtained by performing an up-front conversion from one layout to the other. Stay tuned for concrete examples of this!
Summary
Interleaved and planar layouts are two different ways of organizing the same data. When the data is packed with no padding, they consume the same amount of memory. Regardless of the layout, there are simple formulas that can be used to obtain the samples associated with a pixel.
There may be significant performance advantages to using interleaved or planar layout, due to the principle of locality. When performing pixel-level operations such as color conversion, interleaved layout may produce a lower runtime. When performing channel-level operations such as blurring, planar layout may produce a lower runtime.